Data Visualization Tips#
Time Series Clarity#
Display dates/time frames on the x-axis in ascending order (unless there’s a specific reason not to). This ensures intuitive trend interpretation.
Label Everything#
Always label axes and include units (e.g., “Percentage (%)” or “Population (thousands)”).
Define variables and terms in captions or legends (e.g., clarify if “46.0” represents people, percentages, or scaled values).
Title & Context#
Use clear, descriptive titles that specify the metric and relevant information about the dataset (e.g., “Mean Household Income (2020–2024)” instead of “Income Trends”).
Indicate whether values are sums, means, medians, etc. (e.g., “Median Wait Times for Emergency Care”).
Plot Type Selection#
Line charts: Trends over time
Bar charts: Category comparisons
Boxplots/Violin plots: Distributions
More details about each chart type are discussed in this section by Statistics Canada: Data Visualization
Design Best Practices#
Use consistent colours/legends across plots to aid comparison.
Annotate key trends (e.g., “Peak in 2021” with an arrow).
Avoid clutter: Split complex data into multiple plots.
Avoid Misleading Scales#
Start y-axis at zero unless justified (e.g., log scales). If truncated, explain why in the caption.
Accessibility#
Ensure colour choices are colourblind-friendly (tools: ColorBrewer).
Use patterns/textures in addition to colours for B&W printing.
Normalization for Comparisons#
Normalization removes scale differences, letting viewers focus on relative changes.
When to normalize:
If the main goal is to compare trends or patterns (not absolute values), scale values to a common range (e.g., 0–1 or 0–100%).
How to label:
Clearly state the normalization method in the axis/caption (e.g., “Values normalized to 2015 baseline (=100%)” or “Percent of total group”).
Caveats:
Avoid normalization if absolute values matter (e.g., budget allocations in dollars).
Examples#
Infographic: Building Permits in Canada#
It’s important to include clear elements such as a title, map, explanation, and tables or summary boxes. These elements help ensure your message is easy to understand at a glance.
The infographic below summarizes building permits in Canada for April 2025:
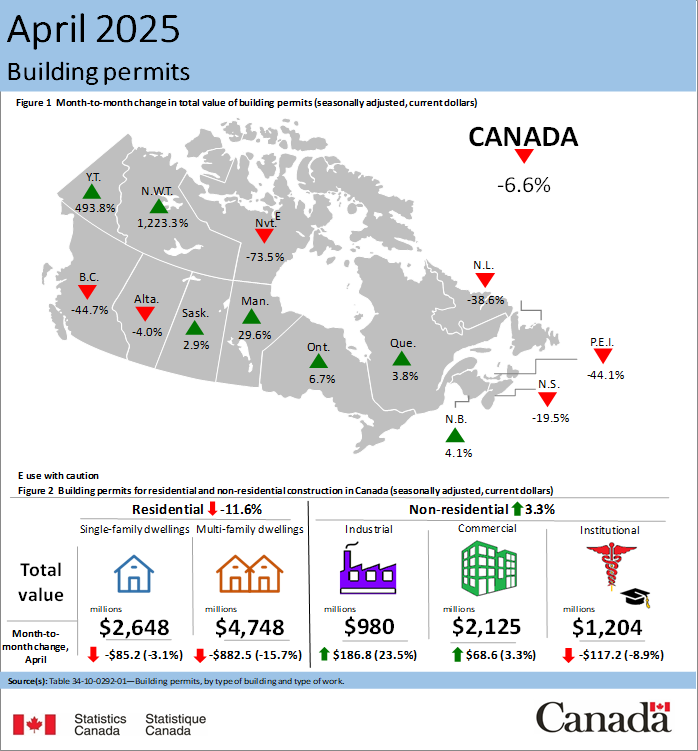
Notice how it uses a combination of:
Title: Clearly states the topic and time period.
Map: Visualizes geographic differences across provinces and territories.
Explanations: Uses colour, arrows, and percentages to highlight changes.
Tables/Summaries: Breaks down the data into categories (residential, non-residential) and uses icons for quick interpretation.
Source: Properly cites the data source at the bottom.